Data Analytics
Data Analytics gigs from Buxonline freelancers, starting at $1.
 tabbasumaliabbas2728New Seller
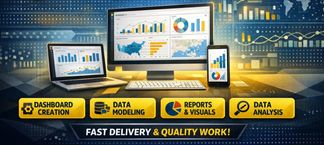
Fiverr Gig Description Are you looking to turn your raw data into clear and meaningful insights? You are in the right place! I offer professional Data Analytics and Business Intelligence services using Excel, Power BI, and SQL. I can clean, analyze, and visualize your data to create interactive dashboards, professional reports, and actionable business insights. What you will get: - Accurate data analysis and cleaning - Interactive Power BI and Excel dashboards - Clear data visualizations and reports - KPI tracking and meaningful business insights - Professional and easy-to-understand results I focus on delivering accurate, clear, and business-focused solutions tailored to your requirements.Let's transform your data into valuable insights for better decision-making.
$100
About data analytics
Data analytics is the practice of examining datasets to uncover patterns, test hypotheses, and answer specific questions that inform decisions. It sits between raw data collection and strategic action, transforming numbers, timestamps, categories and text into insights that organisations can act upon. An analyst might investigate why customer retention dropped in Q3, whether a new feature increased engagement, or which supply chain bottleneck causes the most delay.
The work involves cleaning data, choosing appropriate statistical methods, building visualisations, and communicating findings to people who may not share your technical background. Tools range from spreadsheet software and SQL databases to programming languages like Python and R, alongside visualisation platforms such as Tableau or Power BI.
Doing this well means asking the right question before touching any data, understanding which analytical technique suits the problem, and recognising when a correlation is meaningful versus coincidental. Poor analytics often stems from confirmation bias, misapplied statistical tests, or visualisations that obscure rather than clarify. A skilled analyst knows that a simple bar chart answering the actual question beats a complex dashboard that impresses but confuses, and that documenting assumptions and limitations matters as much as the headline number.
Guides related to data analytics
Data Analytics — questions and answers
- What changes when you analyse time-series data compared to cross-sectional data?
- Time-series data tracks the same variables over successive periods, making trends, seasonality and autocorrelation relevant. Cross-sectional data captures many subjects at one point, focusing on variation between entities. Time-series requires techniques like moving averages or ARIMA models, while cross-sectional suits regression or clustering. Mixing approaches often produces misleading results.
- How do you decide between descriptive, diagnostic, predictive and prescriptive analytics for a given problem?
- Descriptive answers "what happened" using aggregations and dashboards. Diagnostic explains "why it happened" through comparisons and drill-downs. Predictive forecasts "what will happen" with statistical models. Prescriptive recommends "what to do" using optimisation or simulation. The choice depends on whether you need to understand the past, anticipate the future, or guide action.
- Why do pivot tables and GROUP BY queries sometimes return totals that don't match the raw data count?
- Aggregations exclude null values by default, and joining tables can duplicate rows if relationships aren't one-to-one. Filtering applied at different stages produces different denominators. Always verify your grain—the level of detail each row represents—and check whether your join logic inflates or deflates counts before trusting summary figures.
- Can you analyse data that's still being collected, or must the dataset be complete first?
- You can analyse incomplete data if you account for censoring and understand how ongoing collection might bias current patterns. Interim analysis suits monitoring trends or catching data quality issues early. However, statistical significance and confidence intervals assume fixed sample sizes, so conclusions from partial data should be clearly labelled as provisional.
- What makes a metric actionable versus just interesting to know?
- Actionable metrics connect directly to decisions someone can make: conversion rate informs pricing tests, churn rate triggers retention campaigns. Vanity metrics like total page views often lack this connection. A good metric has a clear threshold or trend that prompts specific action, and someone accountable can influence it through changes within their control.
- How do you validate that your analysis will still hold on next month's data?
- Split your dataset chronologically, using earlier data to build your analysis and later data to test whether patterns persist. Check that distributions and relationships remain stable across the split. If your findings rely on a specific period's quirks—a holiday, a promotion, an outage—they may not generalise. Document any time-bound assumptions explicitly.


